This repository is under review for potential modification in compliance with Administration directives.
About Us
All Gateway Sites
Help
Menu
Getting Started
Research Planner
Health & Retirement Studies
Harmonized Data
Policy Explorer
Additional Resources
INTERACTIVE GRAPHS
COUNTRY
Select...
YEAR
CONTEXTUAL
Select...
DOMAIN
Select...
MEASURE
Select...
SUBPOPULATION
Select...
RESET
PLOT
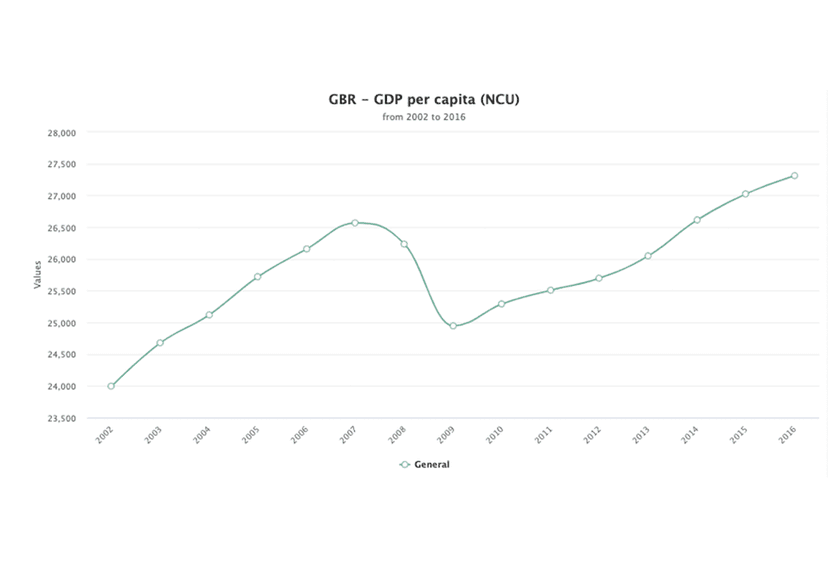
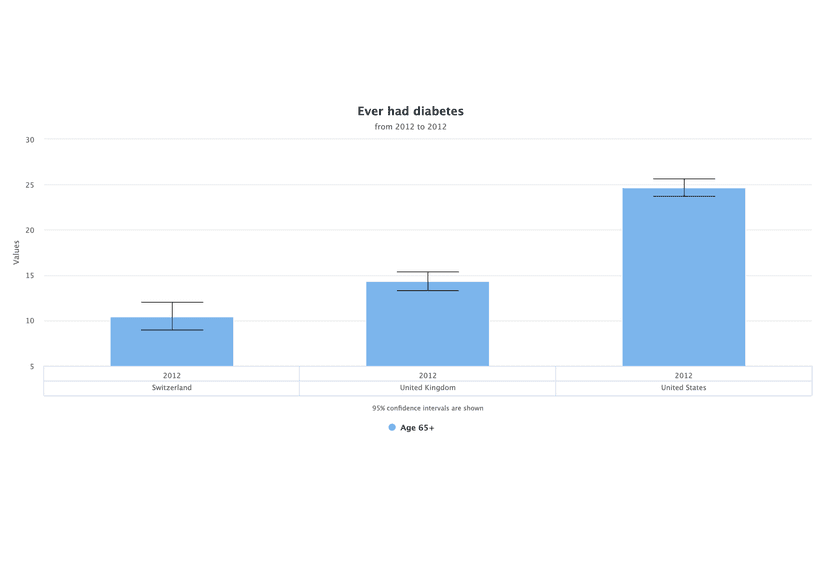
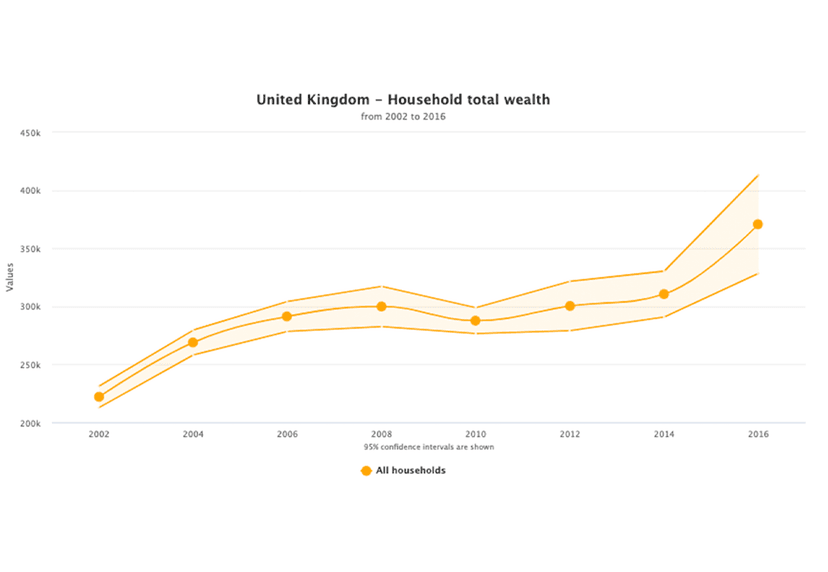
Our analysis and visualization tool to generate graphs, tables, and maps using survey and contextual data. Click on the examples below to explore.
Contrast survey data and contextual data
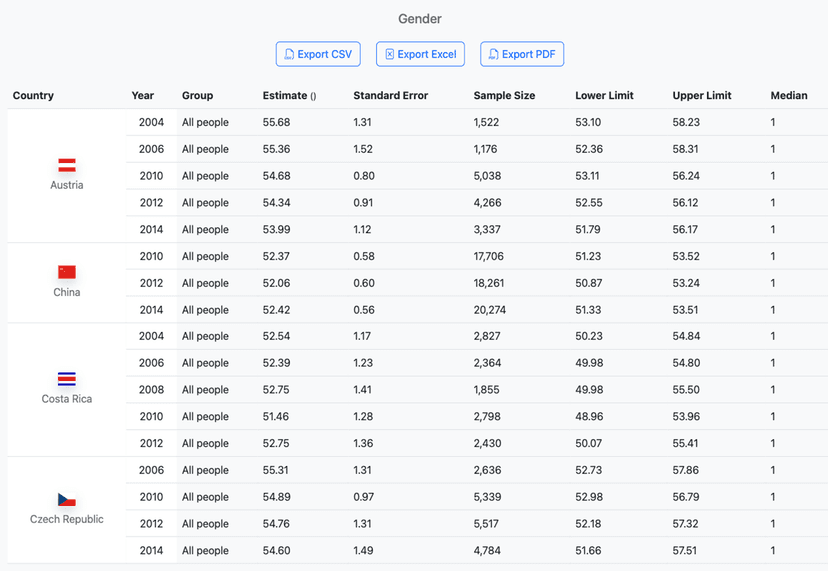
View detailed statistics
See map representation
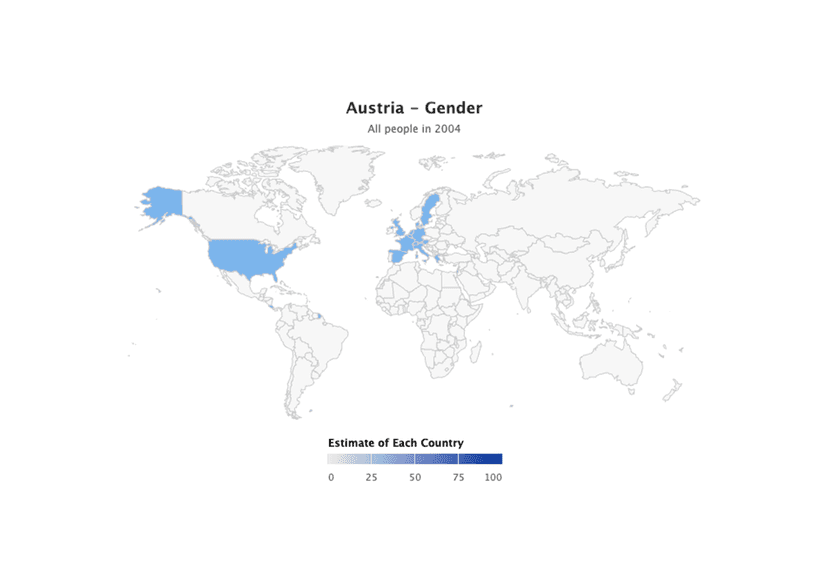
Explore sub-population differences
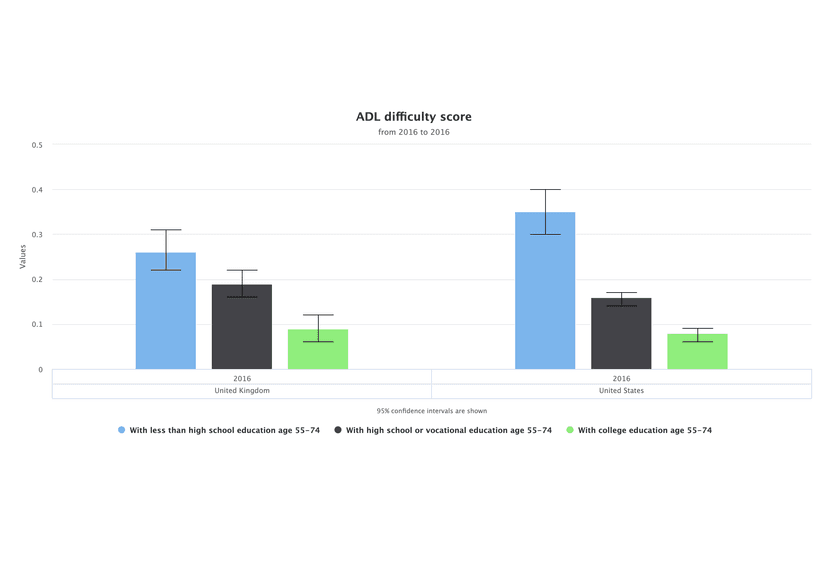
Compare country-level estimates